How to create waypoint layers
To create waypoints you will need to have a layer in your project that you can store these points in. This is generally a point layer.
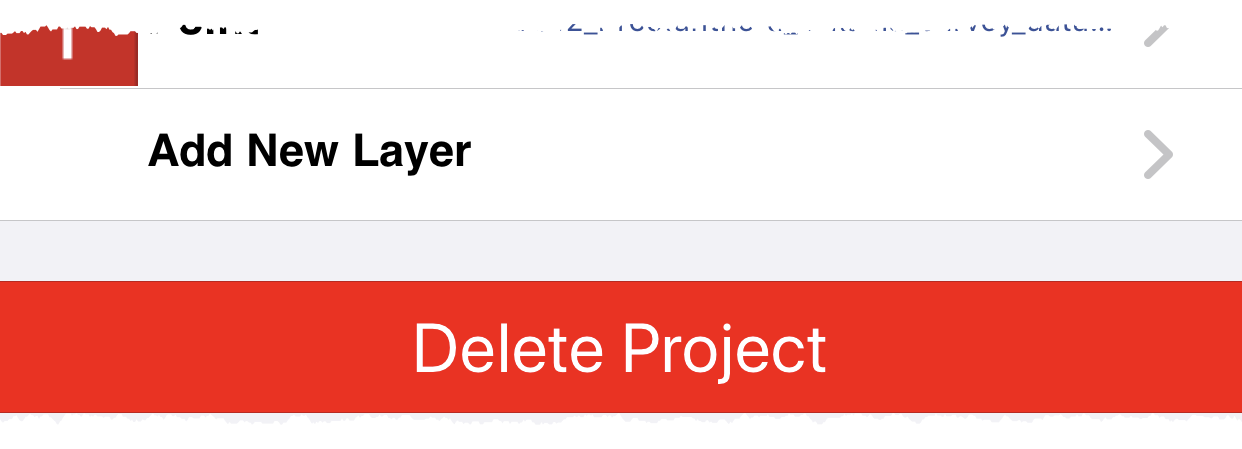
- Create a new layer by pressing ‘Add New Layer’ on a project setting
- Choose “New Empty Layer’
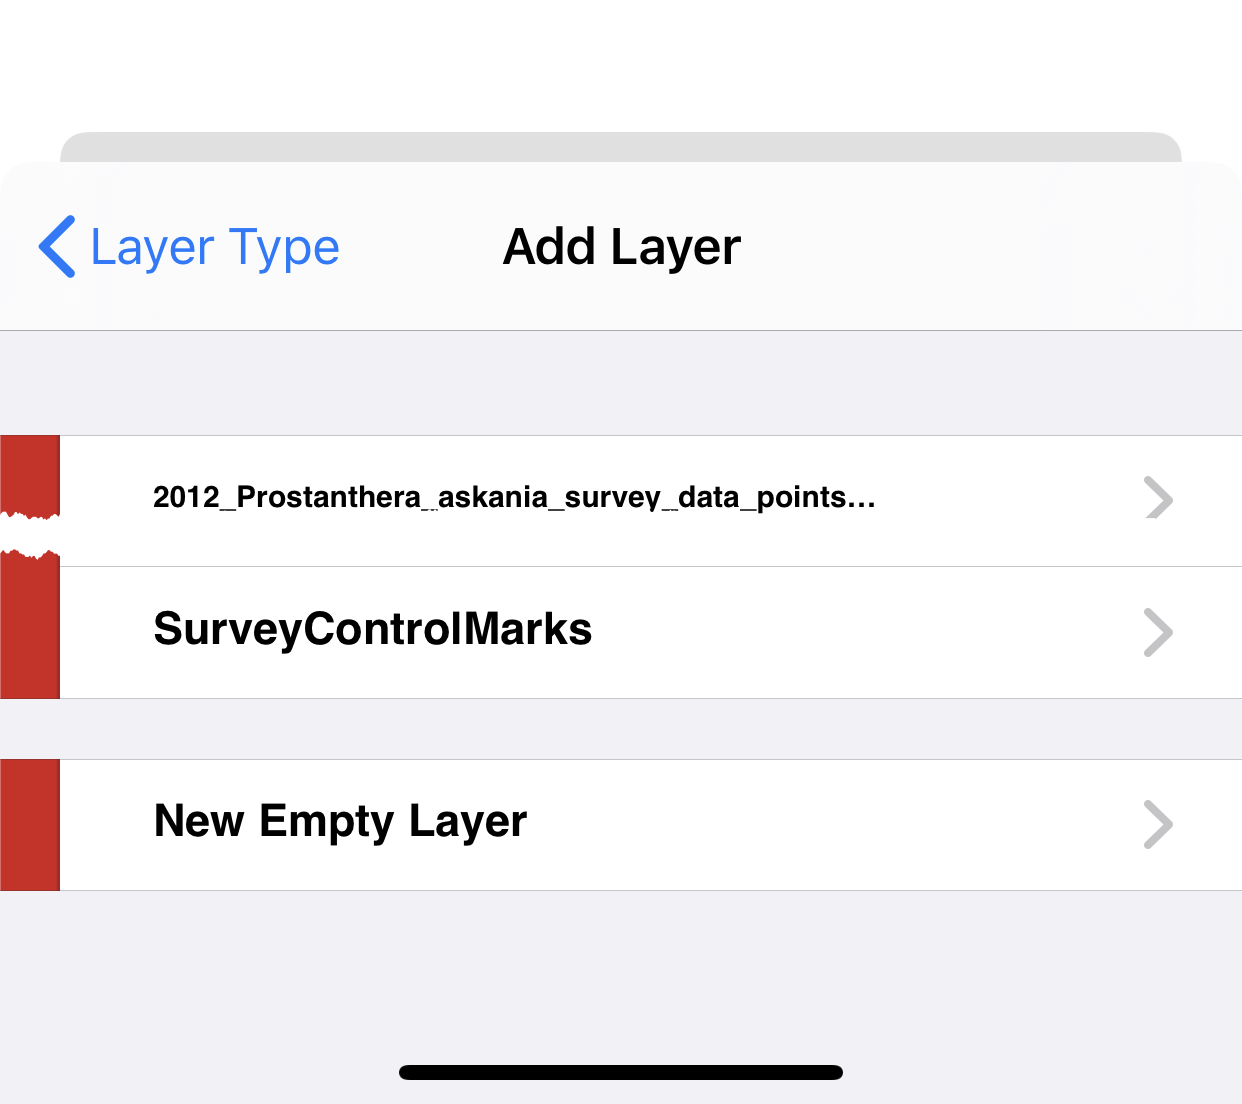
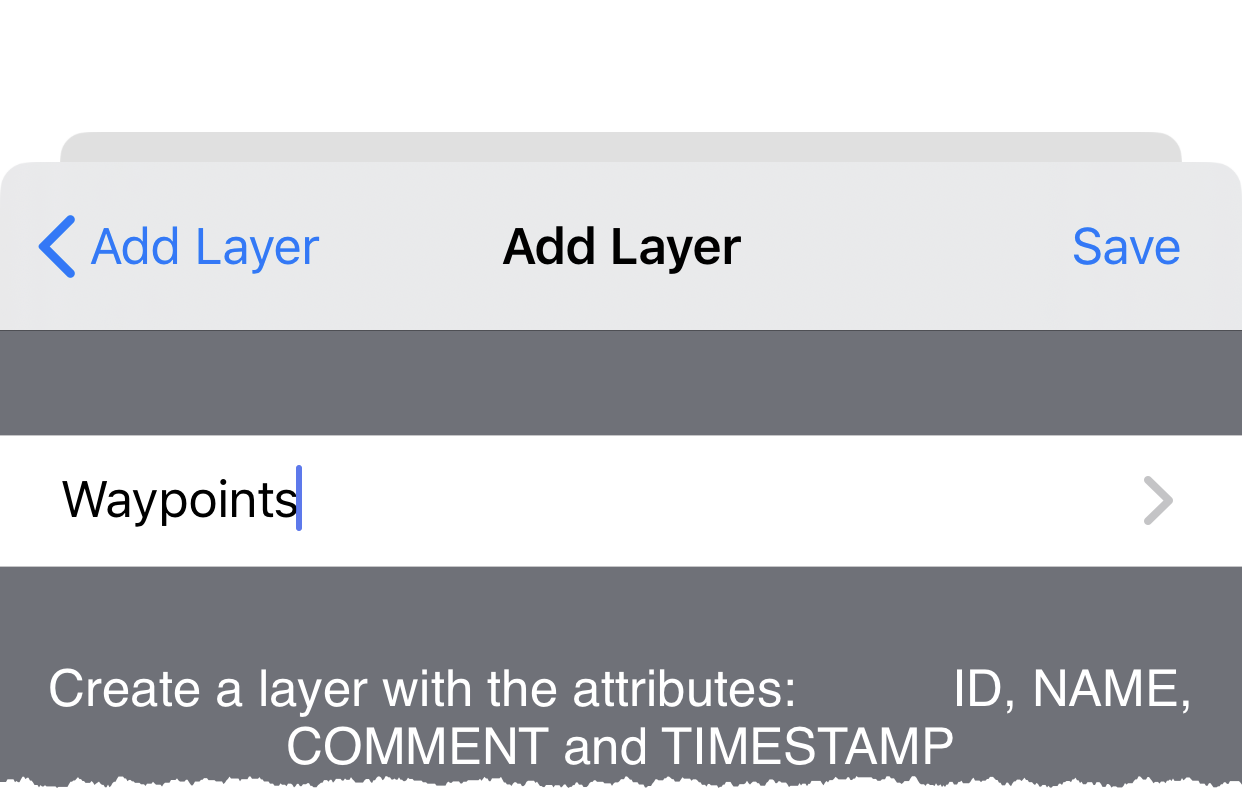
- Choose a point layer and give the layer a name, such as ‘Waypoints’
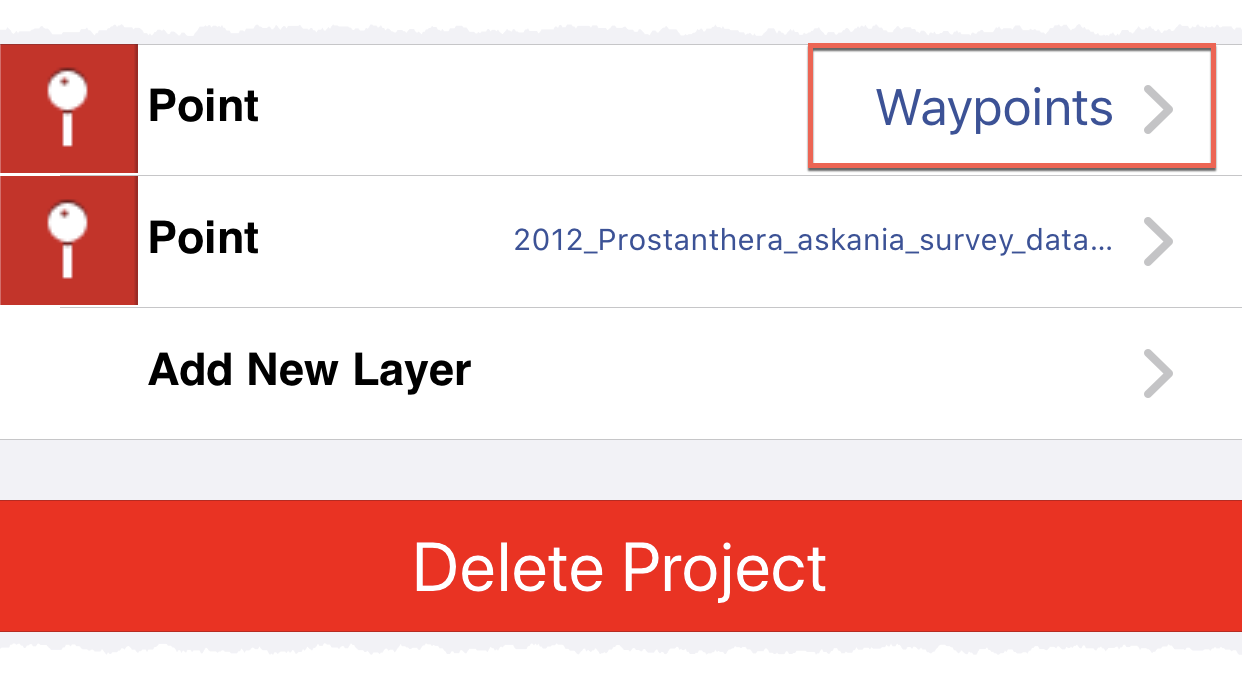
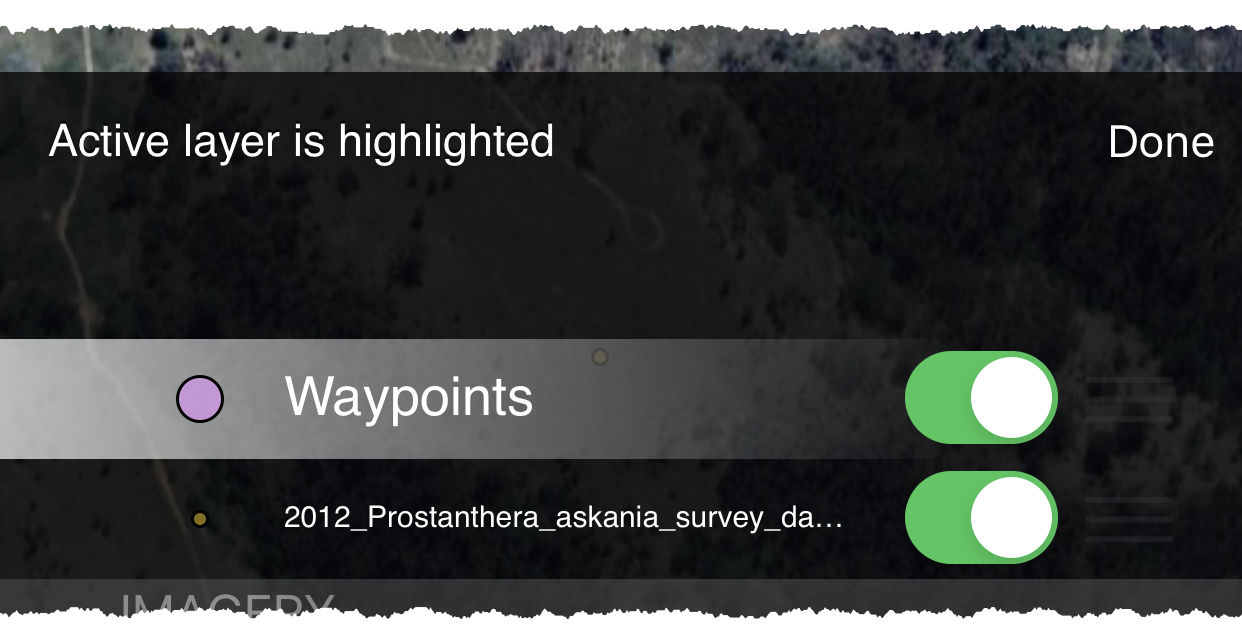
- Waypoints layer is added
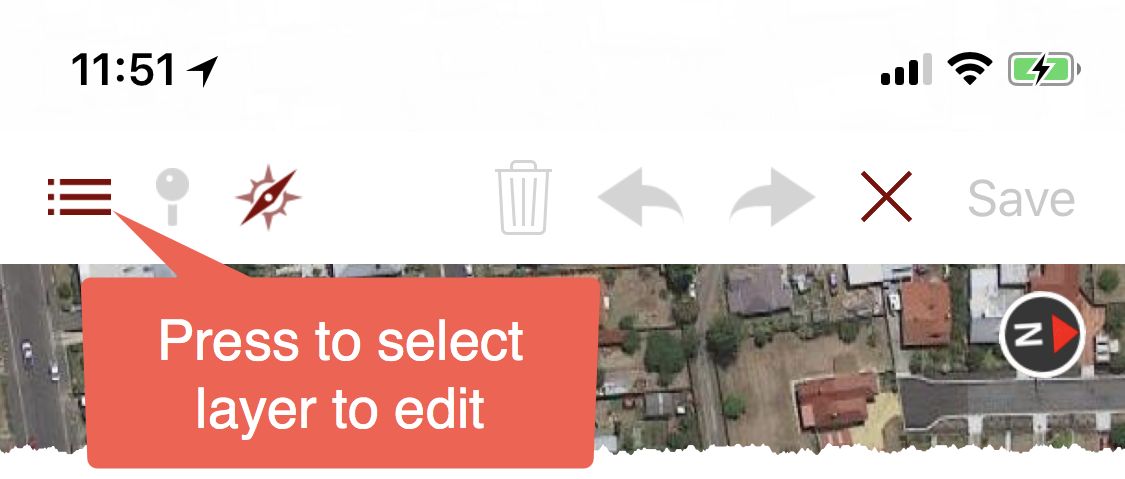
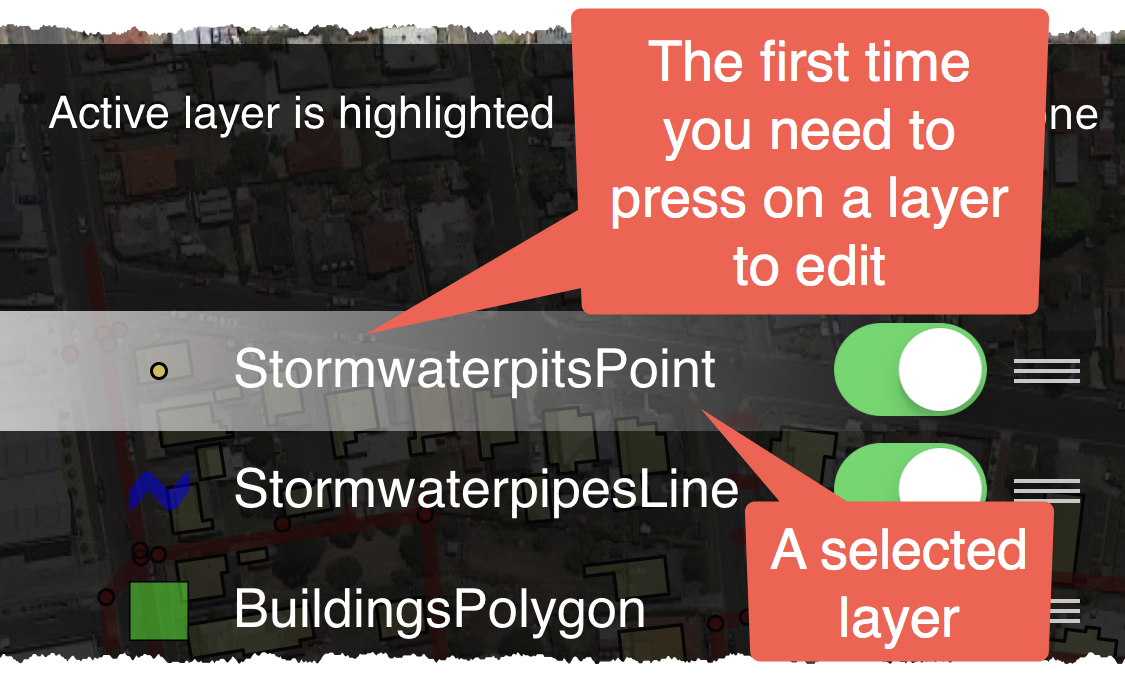
- When editing make sure you choose Waypoints as the edit layer
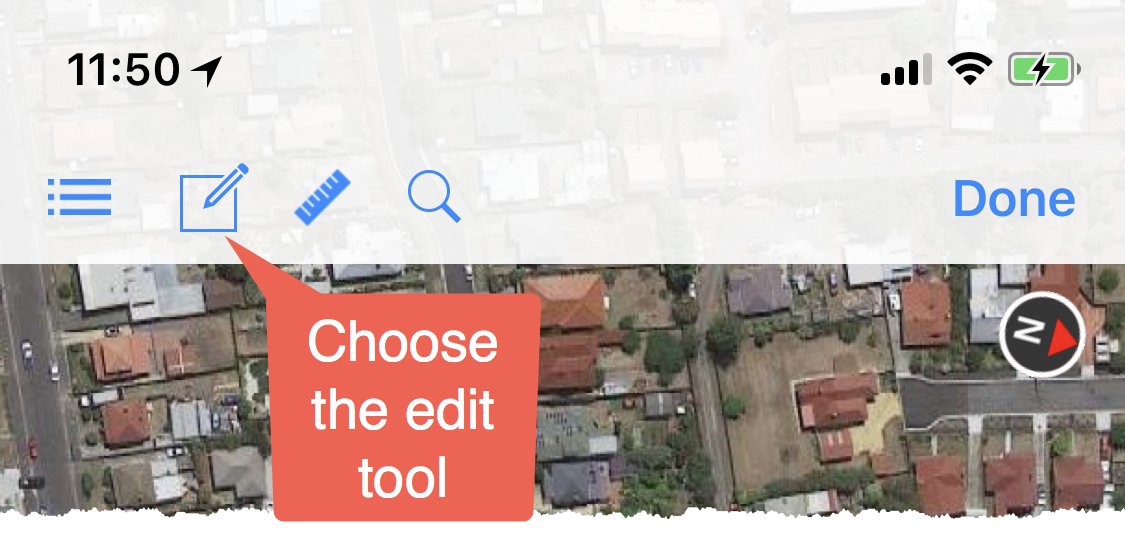
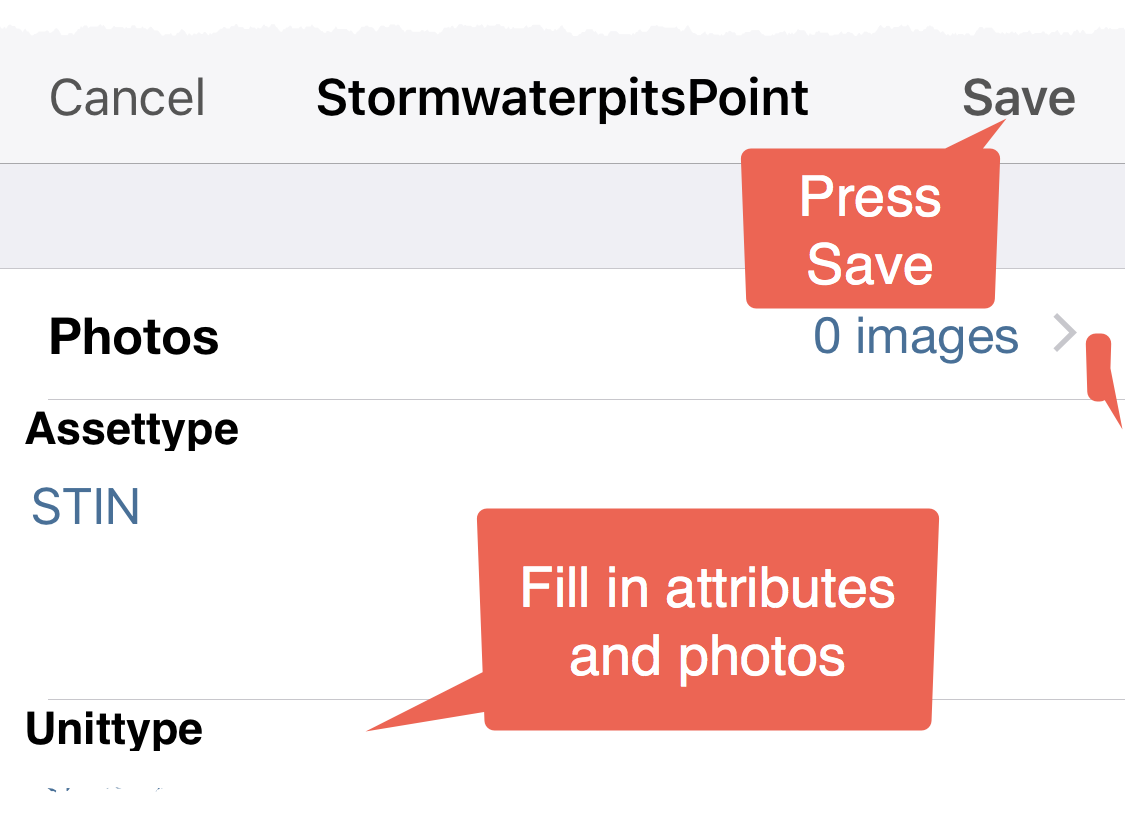
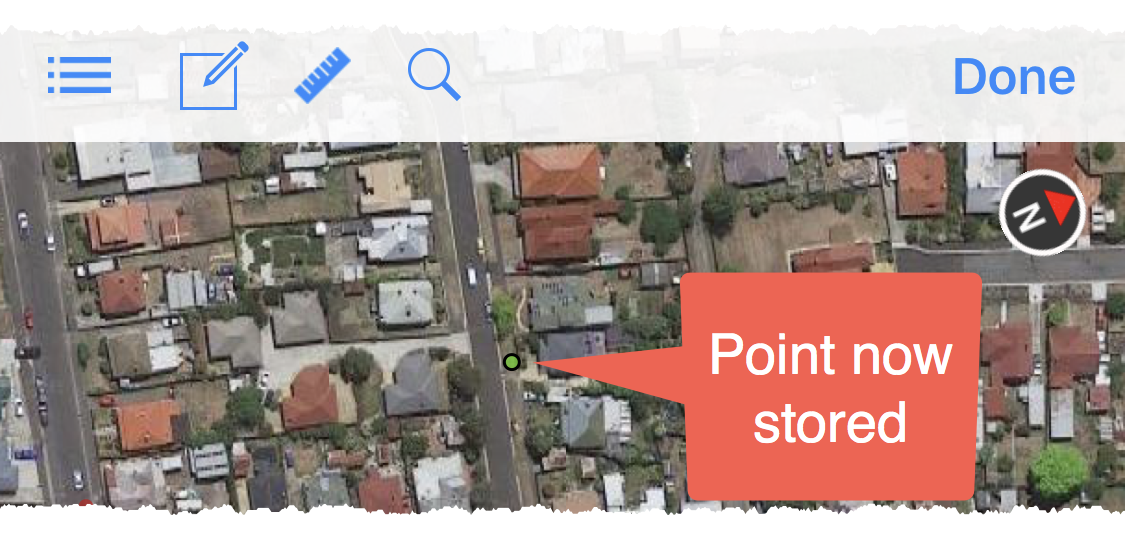
- Add data using the editor

Getting Started: Capturing data with iGIS
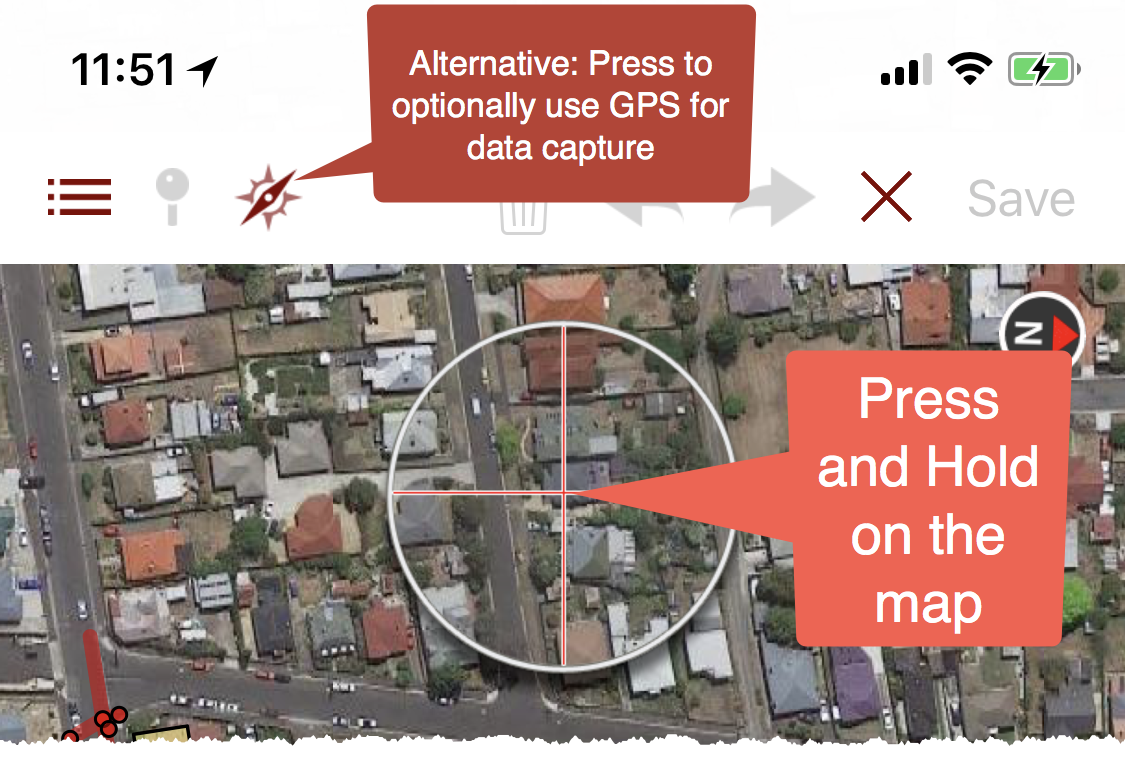
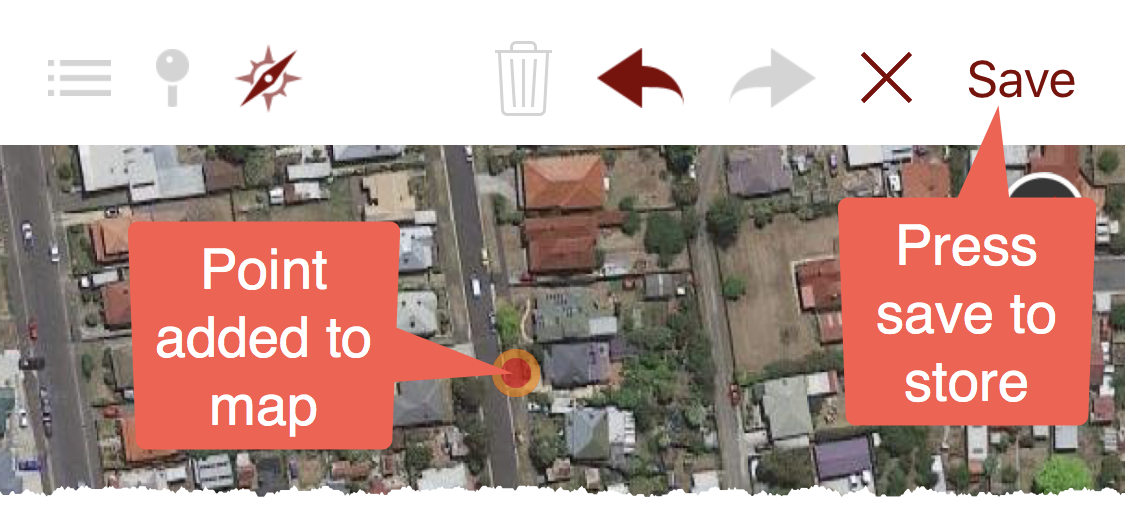
The following screenshots show how to capture data using iGIS. The example below uses the sample “Glenorchy City Council” project.
You can press and hold on the map to add points manually or alternatively you can use the GPS to capture points. This example uses the manual method.
Moving iGIS subscriptions to a new device
All iGIS Pro subscriptions use your Apple ID to identify whether you have a valid subscription. If you have purchased a Pro subscription on one device under your Apple ID, you will able to use iGIS Pro Subscription on any other devices, so long as they are using the same Apple ID.
Note that iGIS for iPhone is a different subscription from iGIS for iPad.
The subscription information may take several minutes to register on your new device, and it will need to be connected to the Internet.
Retrieving/export database
If you need to recover the data stored in iGIS, you can retrieve it from your iPhone or iPad.
iGIS uses two sqlite databases; spatial-store.sqlite and Projects.sqlite. If you retrieve these files they can be used as a permanent backup or sent to Geometry for fault finding purposes.
Since 8.3.10, you can get these database files off your device using iTunes, with your iPhone/iPad connected to your computer, open iTunes File Sharing: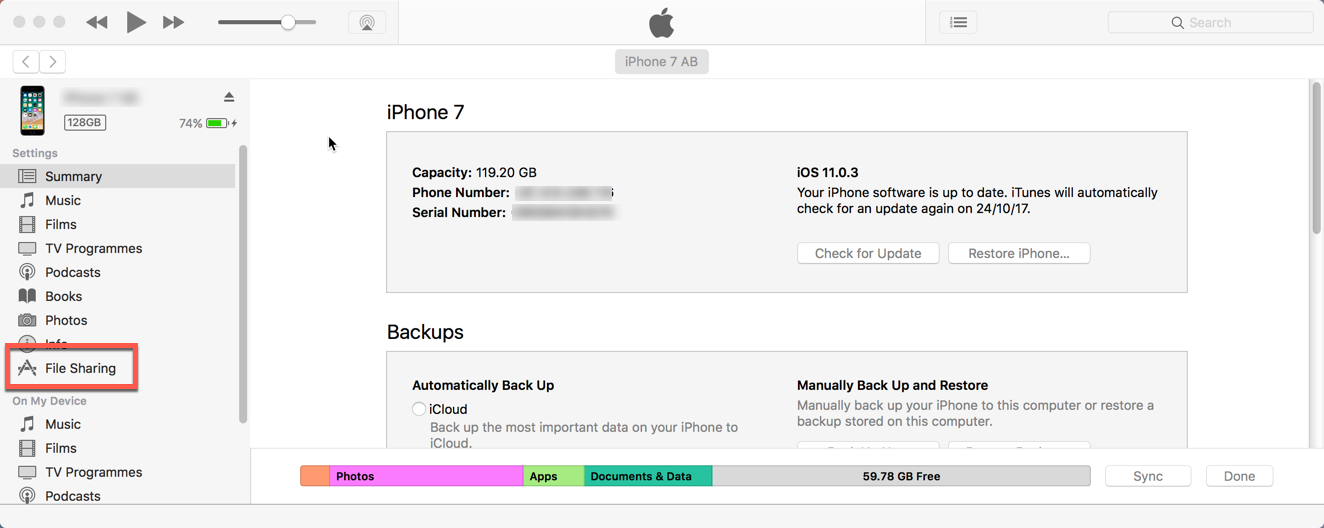
Select iGIS (or iGIS HD) as the Apps under File Sharing:
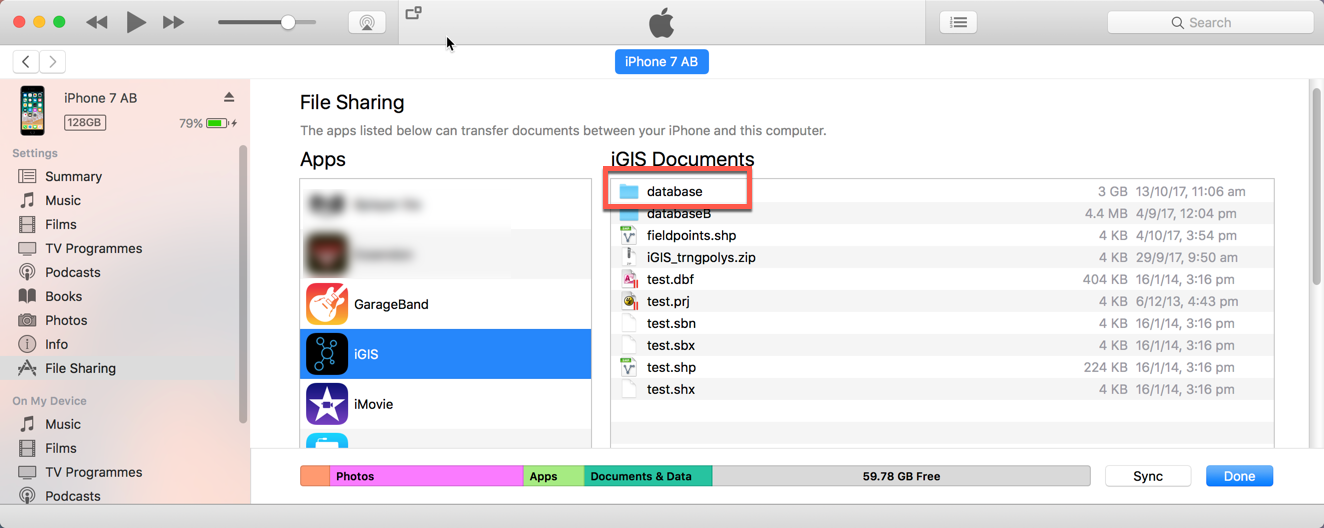
Select the database directory and drag this to the desktop (or another file location). This will copy both the Projects.sqlite and spatial-store.sqlite to your PC/Mac.
Importing shapefile data into iGIS via USB
Follow the below steps to import your shapefile data into iGIS via USB .
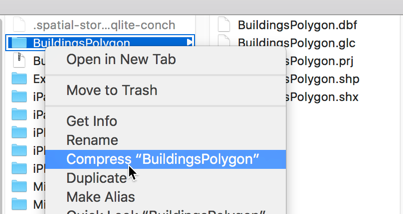
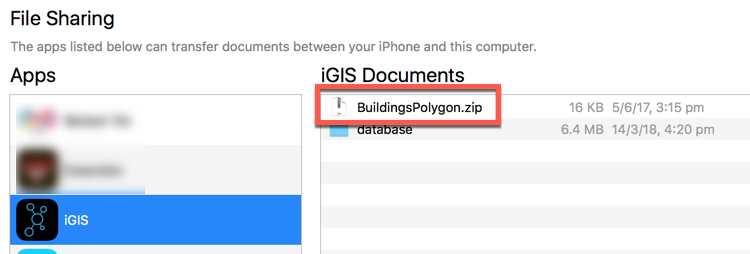
- On your computer, add your shapefile data to a compressed zipped folder. i.e. ‘BuildingsPolygon.zip’
- Connect your iPhone/iPad to your computer via its USB cable, and open iTunes.
- Select your iPhone/iPad under devices and choose File Sharing
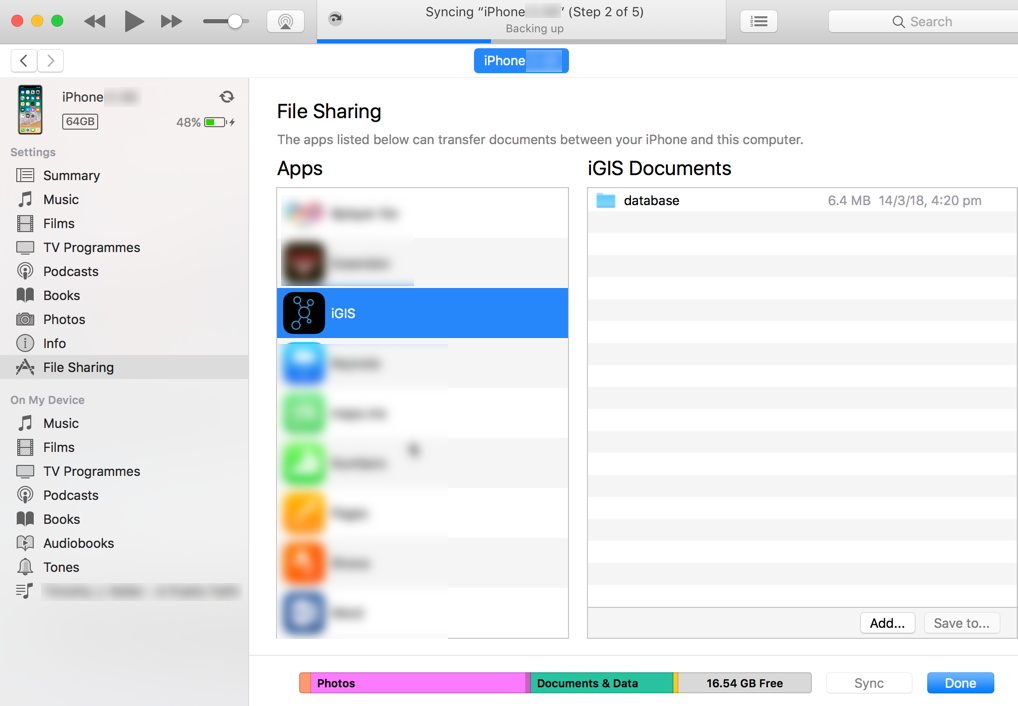
- Use the ‘Add…’ button to add your zipped shapefile data.
- The zipped data will now be on your iPhone/iPad so you can eject your device
- On your iPhone, open iGIS and select ‘Data’ folder from the home screen and press the ‘+’ button to add the shapefile.
- You will see the loaded shapefile.
- Select the shapefile and define, its projection and character set. Select Import.
- The data will begin loading, and indexes will be created.
- You will need to add this data to a project, so that you can see it on a map.
* If your zip file contains multiple shapefiles of the same projection and character set, you can import all the files together by selecting ‘Import All,’ defining the projection and character set, and then selecting ‘Import All’ again to initiate the process.
Sharing Features in iGIS
iGIS 8.3.0 lays the foundation for potentially revolutionary sharing and collaboration features. To see the full list of changes, please read our change log.
With iGIS 8.3.0, multiple users are now able to work on the same spatial layers separately and merge the differences. This guide explains how these sharing features work and their limitations.
To explain how sharing works, the example of three people working on the same data will be used.

Sandra goes south and finds a couple of buildings so she adds them to the map. She discovers that incompetent John had made another mistake. She edits the fourth record. Notice the way the IDs are generated. If Sandra had the same username as Phil, iGIS would think that the features were the same!

Sandra and Phil return from their expeditions. Phil wants to get the changes that Sandra made. She exports her data the same way she always does in iGIS and gives a copy of the zip file to Phil.
Phil imports Sandra’s zip file using iGIS. iGIS realises that the data being imported is in the sharing format and that it has the same name as data already on his device. It offers Phil the option to merge the new data with his existing data.
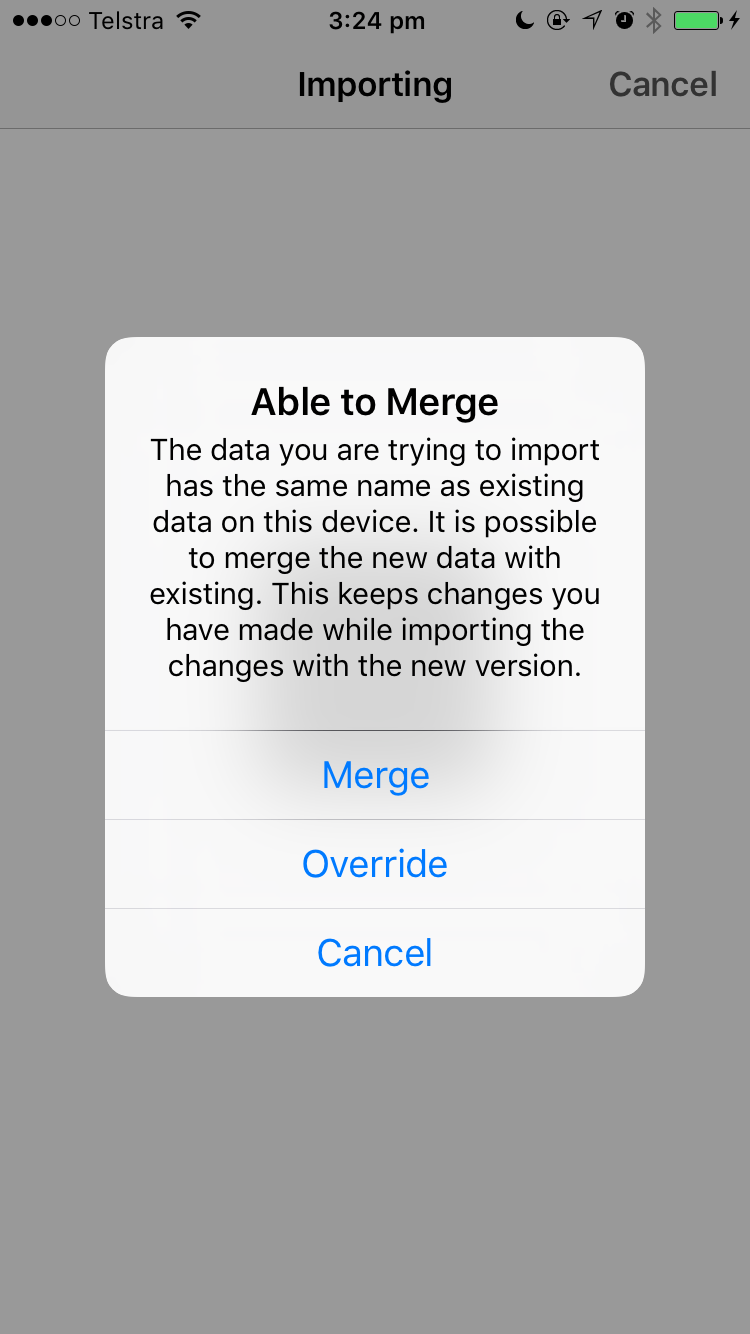
Phil decides to merge Sandra’s data onto his device. iGIS immediately imports every new item that Sandra added. New items will have unique IDs so it is very important that everyone using iGIS chooses a different username than the people they are sharing with. This username can be changed in Settings.
iGIS also keeps track of when the most recent edit was made. To decide which version of the same feature it has to keep, iGIS will always keep the most recent change. If a feature has no changes, iGIS will skip it.
Sandra’s version of John004 was more recently updated than Phil’s, so it replaces Phil’s copy. Phil’s deletion of John002 was more recent than Sandra’s copy, so it is kept.
If Sandra edited Phil’s deleted copy of John002 after he deleted it, it would have been merged in with his data and would be shown on the map again with Sandra’s edit.
After the merge, Phil’s data will look like it is below (with changes and deletions highlighted).

Phil now has a complete copy of all the data. He can give this to Sandra and John and they will get identical data by either overriding their copies or merging.
Note: this explanation simplifies some aspects of the sharing process, such as the length of the IDs.
iGIS 8.3.0 Changes
iGIS 8.3.0 lays the groundwork for some potentially revolutionary features for iGIS. We’ve changed the format of data stored in iGIS to allow people to share and merge changes between different devices. This allows for some nifty collaboration that we hope our Pro users will appreciate. If users like these sharing features, they may be expanded in the future with support for more cloud platforms ( such as Google Drive, OneDrive, etc.) and deeper integration with these services. Please let us know if you have any suggestions or concerns via email.
The major changes in iGIS 8.3.0 are:
- Implemented the ability to share and merge changes on the same layers between multiple devices. For an in-depth explanation of how this works, please read our guide.
- Added a “Tips” screen that shows off the latest features of iGIS when a user updates. Pro users may turn this off.
- Provided a link on the main screen to some basic app settings.
- Updated the Dropbox API to v2.
- Some users had noticed the size of their database was not decreasing when they deleted layers. There is now an option to clean out the database on startup.
- Removed all references to the email newsletter.
- Some UI changes to make the interface more appealing.
- Bug fixes and stability improvements.
Width and Colour Attributes of Polygon Outlines
As of iGIS 8.2.0, there is now an option to set the width of a polygon’s outline. There is also a method to set a colour attribute; similar to how a polygon’s fill colour can be assigned an attribute. This post will explain how to do both.
Outline Width
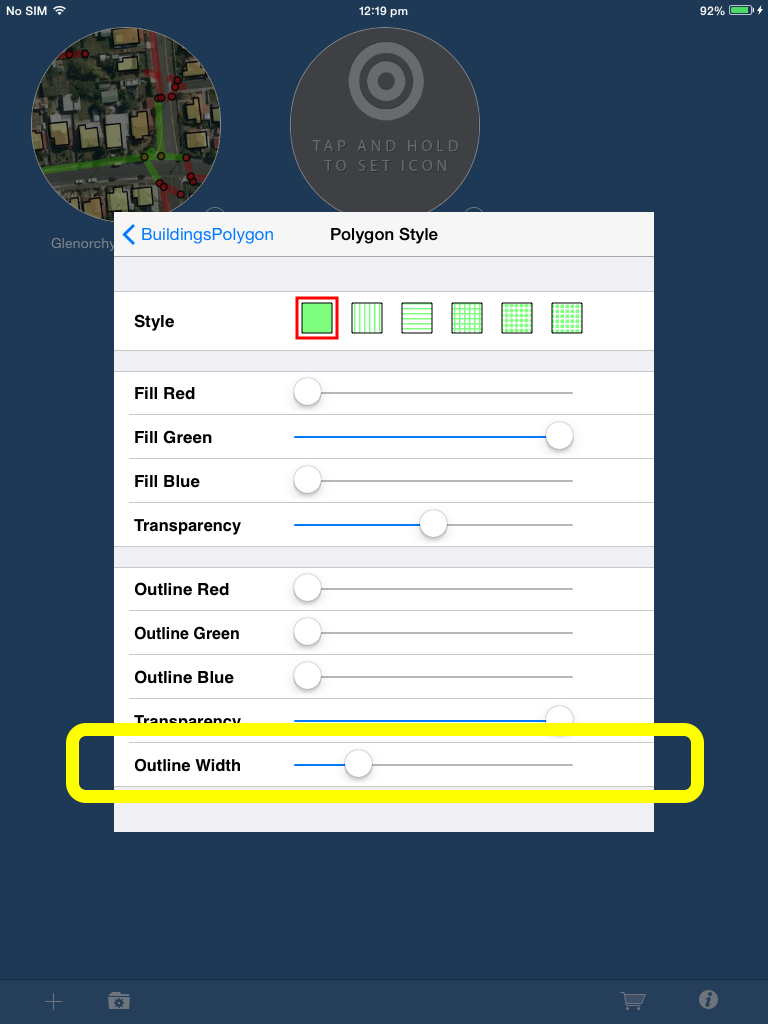
To set the outline width, go to project settings and select the layer you wish to edit. It must be a polygon layer. Scroll down and select “Style/Color”. You will now see a slider for the “Outline Width”. Sliding this will control how thick the polygon’s outline appears on the map. Note: the outline width on the style sample boxes will not change.
Outline Colour Attributes
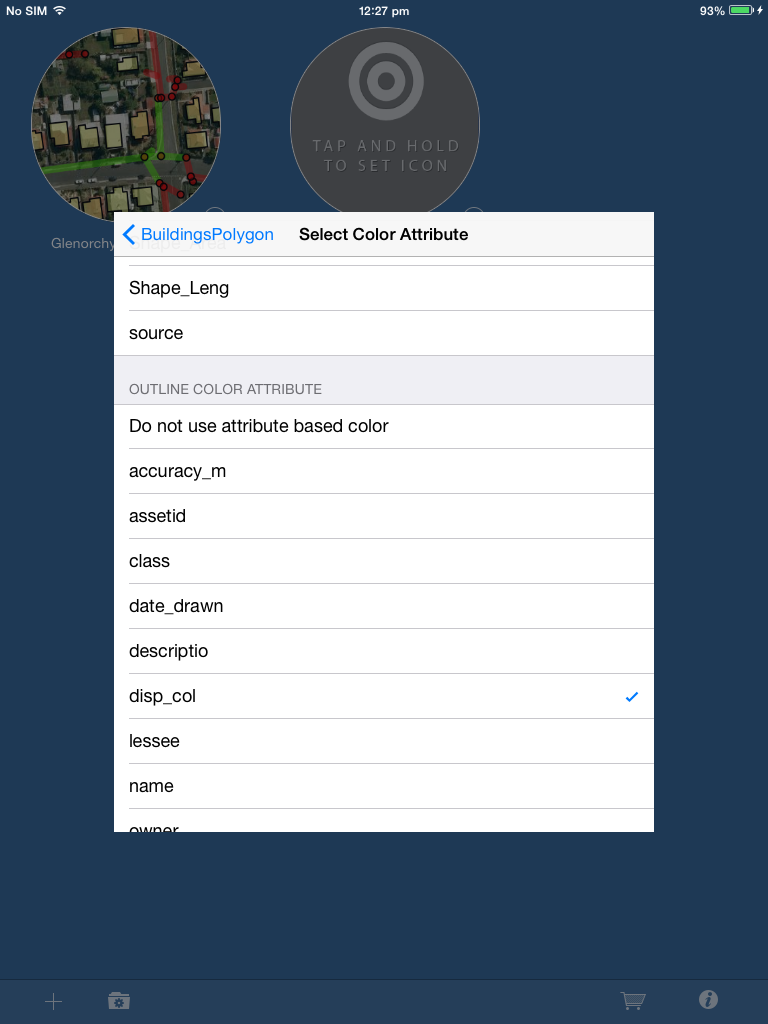
Go into project settings and navigate to the polygon layer you wish to edit. Now if you select the “Color Attributes”, there are two sections in the table. The first one is the Fill Colour Attribute and the second is the Outline Colour Attribute. To select an outline attribute, scroll down until you get to the outline section and select the attribute you wish to use to colour the outlines of your polygons.
Scale Dependant Rendering
As of iGIS 8.2.0, there is now a new way zoom scaling is handled for layers. These changes can be used to dramatically improve performance in your project. For example, you might display low detailed polygons when zoomed out and switch to a highly detailed layer when zooming into the map.
To see the new changes, go into project settings and select a layer. Scrolling down, you should now see two sliders:
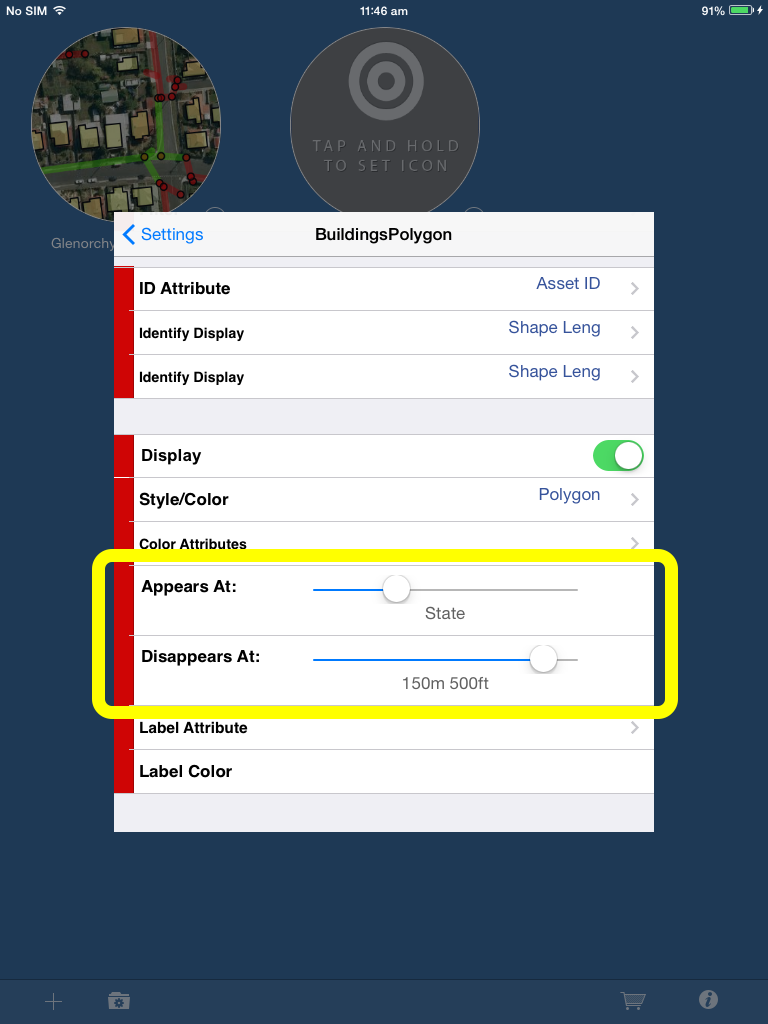
The “Appears At” slider controls the maximum zoom a layer is visible at. The “Disappears At” slider controls the minimum zoom a layer is visible at. In the screenshot above, the BuildingsPolygon layer will be shown from a state level to 150m. If the user zooms in closer than 150m or zooms out further than the state level, the layer will disappear.
Make a Field Mandatory
From iGIS 8.2.0 onwards, there is now an ability to make feature attribute fields mandatory. This is done via a layer’s .glc file. Here is an example of a working .glc with mandatory fields:
The mandatory parameter is passed in the header of an attribute or codelist. In other words, an attribute header that is mandatory will look something like this:
<Attribute column="asset_id" readable-name="Asset_ID" mandatory="YES">
and a codelist that is mandatory looks something like this:
<CodeList name="TrueFalseCodes" type="C" length="1" mandatory="true">
Notice how it doesn’t matter if you pass “YES” or “true”, iGIS will interpret it as mandatory. In fact, you can use YES, yes, TRUE, true, 1, y or Y to set mandatory.
If there is no mandatory parameter passed, the default is NO.
If you like, you may explicitly set mandatory to NO, no, false, FALSE, n, N or 0 to ensure the attribute or codelist is not mandatory.